Everything, at length

What is in the tool

Eleven things, and none of them is a wizard step

A site moves through five stages, the same five the tool shows: Boundary, Public data, Surfaces and curve number, Results, and Report and share. Practices, the aerial photograph and calibration are each a side analysis that returns to a stage. What sits under each is below.

Where it works: sites in the contiguous United States (the lower 48 states). Alaska, Hawaii, Puerto Rico and the territories are not covered, because the public data sets it reads do not cover them.

The boundary, and what the public data says about it Stages 1 and 2: Boundary, Public data
Draw it, cut holes for excluded buildings, edit it vertex by vertex. The enclosed area is computed on the ellipsoid and shown while you draw. Then one button queries the soil survey, the land cover map, the elevation service and Atlas 14, and reports each figure with its dataset edition and the date it was retrieved. The soil survey and the land cover map are required, so if either fails nothing is stored; the elevation and rainfall services are read beside it, so a slow one costs you that figure and nothing else.
Estimated inputs, each with the factor it could be wrong by Stage 2: Public data
Where a figure cannot be read from any dataset, CurveNumber estimates it and says so. Every estimate can be replaced with your own, with a reason, and the whole chain reruns and reports what else moved. The estimates that are refused rather than estimated are listed separately. A time of concentration under the TR-55 minimum of 6 minutes is raised to 6 minutes, and the results and the report say so.
Twenty-four green infrastructure practices, seventeen of them modeled Side analysis, from stage 3
Bioretention, permeable pavement, infiltration trenches, swales, ponds and the rest, defined by dimensions or by curves you supply, and routed through the storm. The other seven are named and then refused, in writing, with what would resolve each one. Where the water went is reported in separate channels, and retention and filtration are never merged into one treated volume, because many jurisdictions credit the first and not the second.
The green roof, which is deliberately not a practice Side analysis, from stage 3
It has its own screen, its own record and its own kind of answer. A green roof is not routed, because the question is whether the growing medium had room for the storm, which turns on the evapotranspiration rate and the antecedent dry period. No dataset publishes a green roof's own recovery rate, so CurveNumber estimates it from gridMET reference evapotranspiration and a crop coefficient of its own, estimates the dry period from the GHCN-Daily record, and records both as assumptions rather than as citations. Accept them or replace them, and you get a capture statement with a signed margin in hours.
Local rules: the manual you are reviewed against, transcribed Its own section
Enter the stormwater manual, its edition, who read it and what figures it publishes. Transcribe its credit rules, including the qualifying conditions, which are the substance of a rule and not a footnote to it. Nothing is inferred: a project holding one manual does not govern its sites by implication, and a manual with rules for other practices does not credit this one by implication either.
Credits and compliance, with a third state that is not a failure Its own section
A credit claimed under a transcribed rule comes back granted, denied by the manual, or refused for want of a measurement. The third is not zero and is never shown as zero. Compliance compares a volume CurveNumber computed against a number a person entered, and where the comparison cannot honestly be made it is withheld entirely, with the reason printed, rather than reported as a shortfall.
An append-only change log, with every change priced Its own section
Every change is saved as a version holding a full copy of what the answer depends on, and what the change was worth, computed by running the site on the state before it and the state after. Saved versions are never edited; a correction is added after them rather than written over them. You can compare any two versions and see the boundary, the areas, the practices and the waivers that differ. Figure changes are worded distinctly: up, down, added, gone, appeared, withheld, because a missing value is not a zero.
Two refusal ledgers, kept apart on purpose Its own section
A waiver is a signed decision to waive a refusal. The refusal stays on the record, with a person's name and reason under it. A resolution is supplying the missing input, such as a local credit rule, a green roof's drying rate or a cistern's demand schedule, so the refusal never happens. The two are kept in separate lists, so a waiver can never read as an answer.
Publish a reviewed analysis, or revoke it Stage 5: Report and share
A fixed copy at its own web address, public or password protected, with no expiry or a fixed one, and revocable. You have to preview the whole thing, report and change log, before the publish button will enable. Stated plainly on the screen: expiry and revocation block future access and cannot recall a downloaded copy.
An AI assistant that cannot invent a number Beside every step
Ask where a figure came from and it walks the chain: the table row, the soil group, the land cover, and any change a person made and why. Ask what would change and it runs that scenario through CurveNumber rather than guessing. It quotes from the reference library and from your own record, and gives you the page. A check reads every draft before you see it and blocks any number that the run or your record does not already hold. Using it sends your site's record to a commercial model vendor, and the privacy page lists what is sent.
Aerial imagery, as a guess you accept or reject Side analysis, from stage 3
The tool fetches a public NAIP photograph of your boundary and sorts it into impervious cover, vegetation, bare soil, water and shadow. Nothing in the product uses it until you accept it. What it costs to use is set out below.

Warnings that cost nothing and call no model

Thirteen automatic checks run over the site record every time the workspace is opened: an implausible input combination, a composite curve number that disagrees with the measured impervious share, a design storm that does not match the one the manual names, a dataset that has gone stale, an area above the method's limit or below the threshold at which deriving means anything.

They are not an assistant. No model is called, nothing is sent anywhere and nothing is charged. One of them blocks the action outright rather than warning about it.

An override is not a text box

The interface states what the choice is worth before it is made, asks for a reason in proportion to that figure, and names the account the sentence will be filed against. An engineer who has to write "because the software said B" tends to go and look instead, which is the entire intent.

The soil survey rates no hydrologic group for a large share of urban land, which is the ordinary case on the sites this product is for. That is not a blank to fill with B. It is a question, and it goes to the person who can answer it.
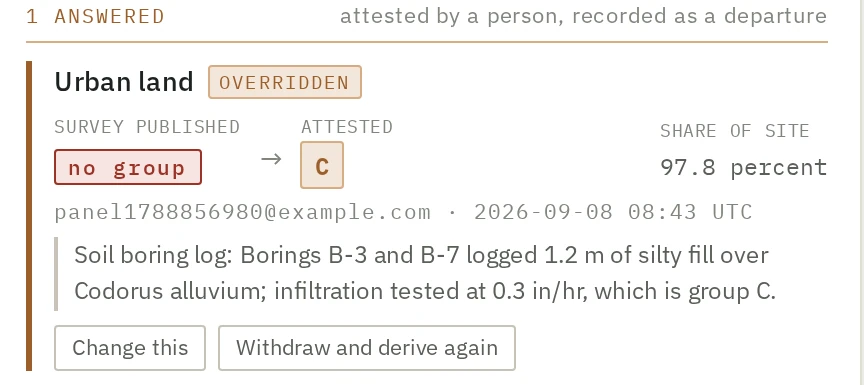
An answered question in the interface: map unit Urban land, marked overridden. The survey published no group; a person attested group C. The share of site is 97.8 percent, and the reason reads: soil boring log, borings B-3 and B-7 logged 1.2 meters of silty fill over Codorus alluvium, infiltration tested at 0.3 inches per hour, which is group C.
An answered question, which is not a resolved one. Both halves stay on the record.

Why it refuses

Where a material share of a site is unresolved, no headline number is produced

CurveNumber separates the states that have different remedies and keeps them separate all the way to the screen. A service being down and a site being outside the survey are not the same problem and are never the same message.

The threshold is a tenth of the site. It is recorded as a judgment rather than a finding, and it is one of the defaults you can see and argue with.
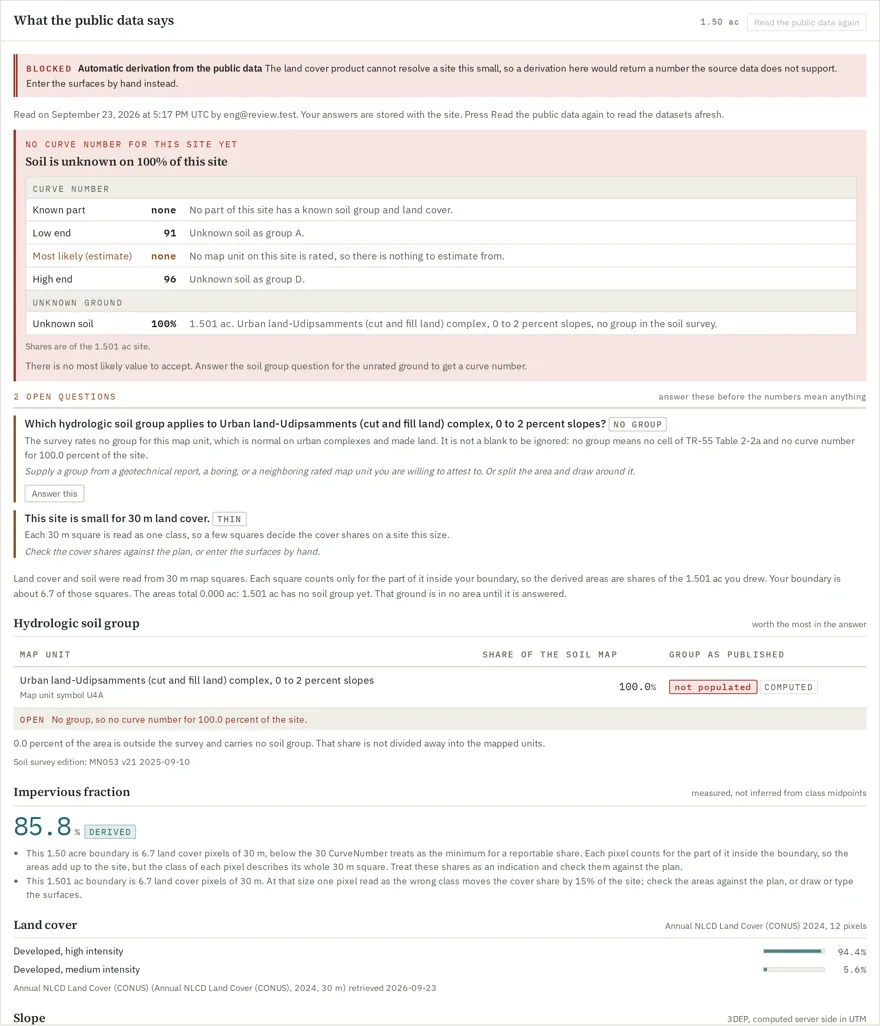
The public data panel refusing to answer. A red panel reads: no curve number for this site yet. Soil is unknown on 100% of this site. A table gives the curve number for the known part as none, the low end as 91 with the unknown soil taken as group A, and the high end as 96 as group D. Below it, two open questions: which hydrologic soil group applies to Urban land-Udipsamments, and that the site is small for 30 m land cover.
A real site, refused. This test site is entirely Urban land-Udipsamments, which the soil survey rates with no hydrologic group. The area is neither defaulted nor dropped: it is carried with its acreage and its map unit name, and it becomes a question.

The list of default values

An assumption that states its own price

One hundred twenty-six values in CurveNumber are defaults rather than anything read off your site. Every one of them is written down in one list, classified by what would have to happen for it to change, and carries two fields that turn a lookup into guidance: what it is worth in the answer, in computed figures rather than adjectives, and what evidence would displace it.

Fifty-four of them say no external source exists on their face, because nobody publishes the figure at all. Seven more say the source exists and was not checked, which is a different admission with a different remedy, and the two are never merged.

That is also how the interface can be quiet. A user shown thirty defaults confirms none of them, so CurveNumber ranks its own assumptions by what they are worth on this site and surfaces the two or three that move the answer.
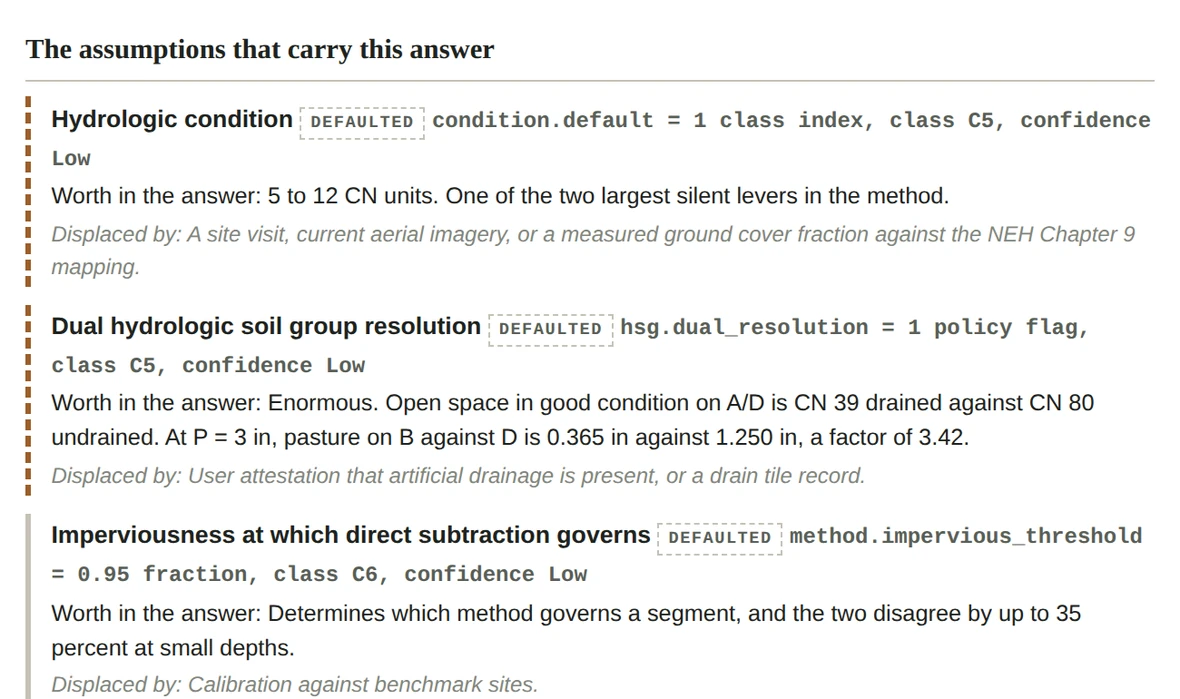
A section of the report headed: the assumptions that carry this answer. Three assumptions are listed, each marked defaulted, with its class and confidence, then a line beginning worth in the answer, then a line beginning displaced by. The dual hydrologic soil group entry reads: enormous, open space in good condition on A over D is CN 39 drained against CN 80 undrained.
The same default values, on the face of the report. Six ranked assumptions reach the page; the rest are counted and pointed at rather than printed.

Open to anyone

Reference views: the default values and the curve number tables

The tool has five reference views; two are shown here. They read the same data a run reads, so there is no separate marketing copy of them to fall out of date.
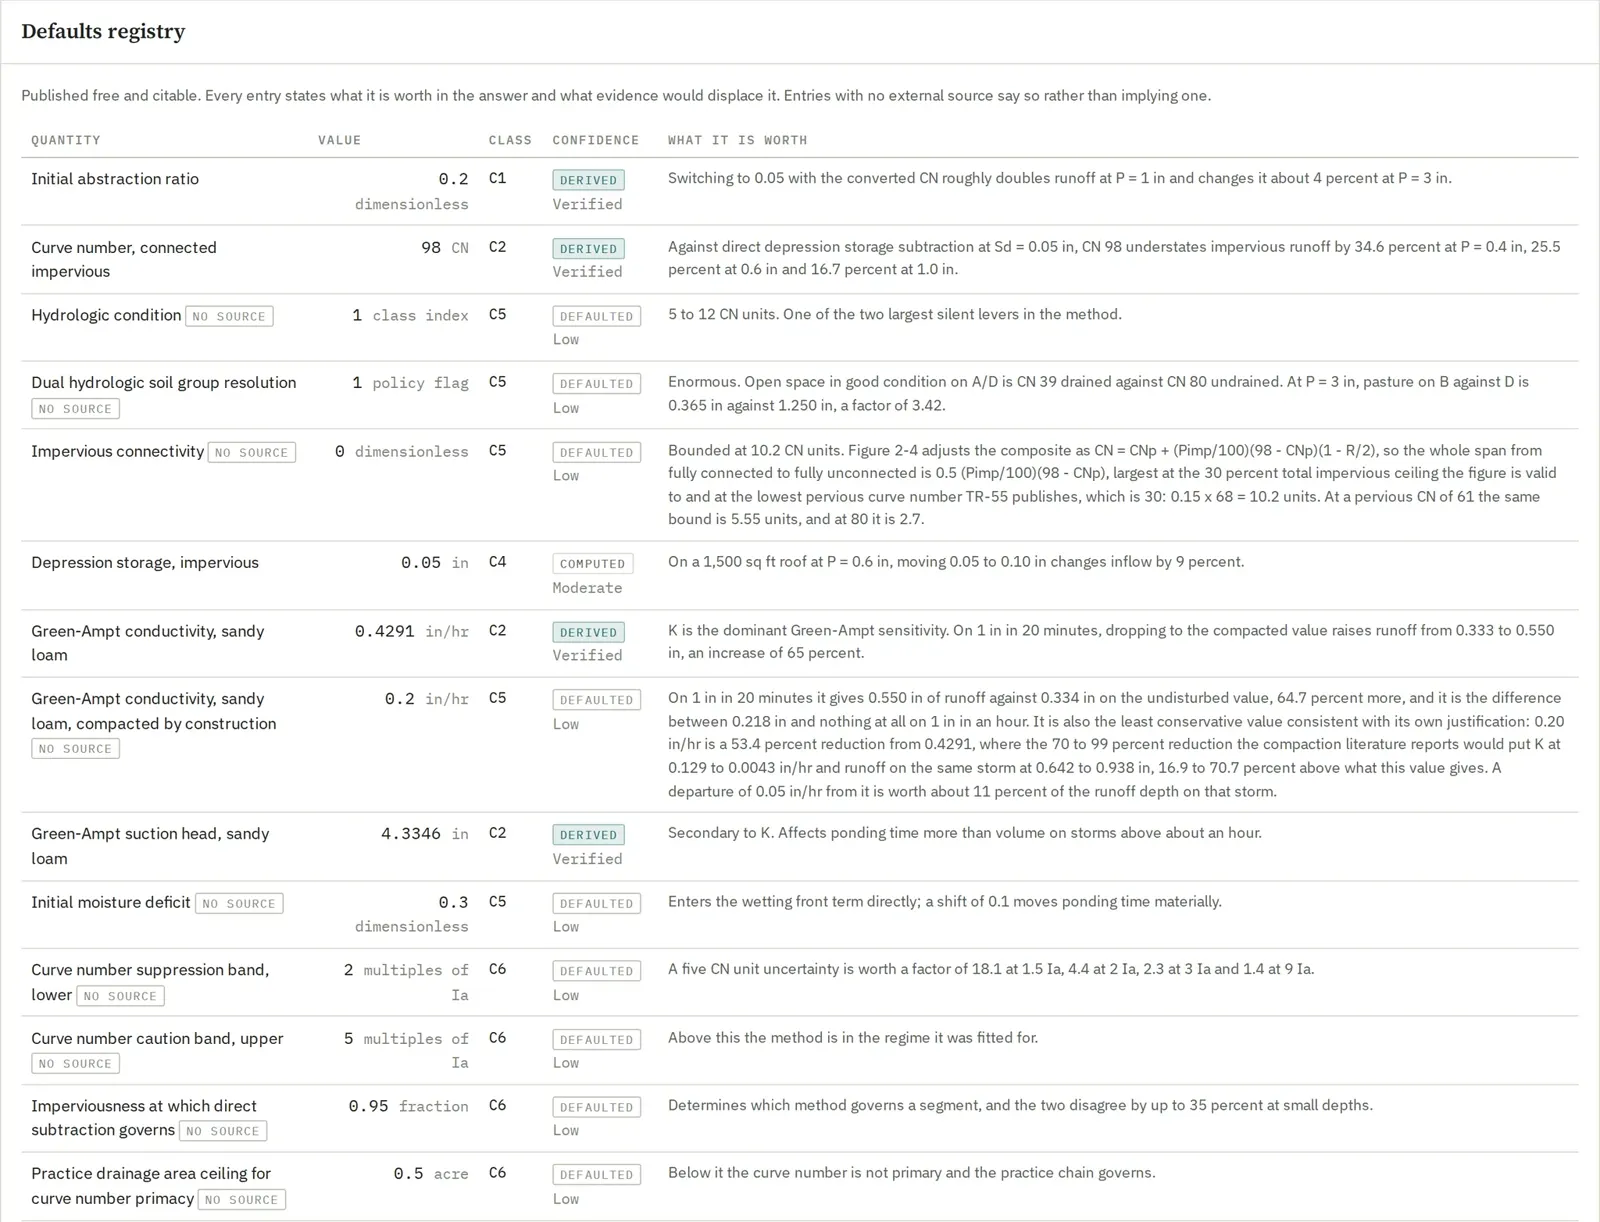
The default values panel. A table with columns for quantity, value, class, confidence and what it is worth. The first rows show the initial abstraction ratio at 0.2, derived and verified; the connected impervious curve number at 98; hydrologic condition, marked no source, defaulted and low confidence, worth 5 to 12 curve number units; and dual hydrologic soil group resolution, marked no source.
The list of default values, in the product. Every entry states its class, its confidence, and what it is worth in the answer. Entries with no external source carry a no source chip rather than implying one.
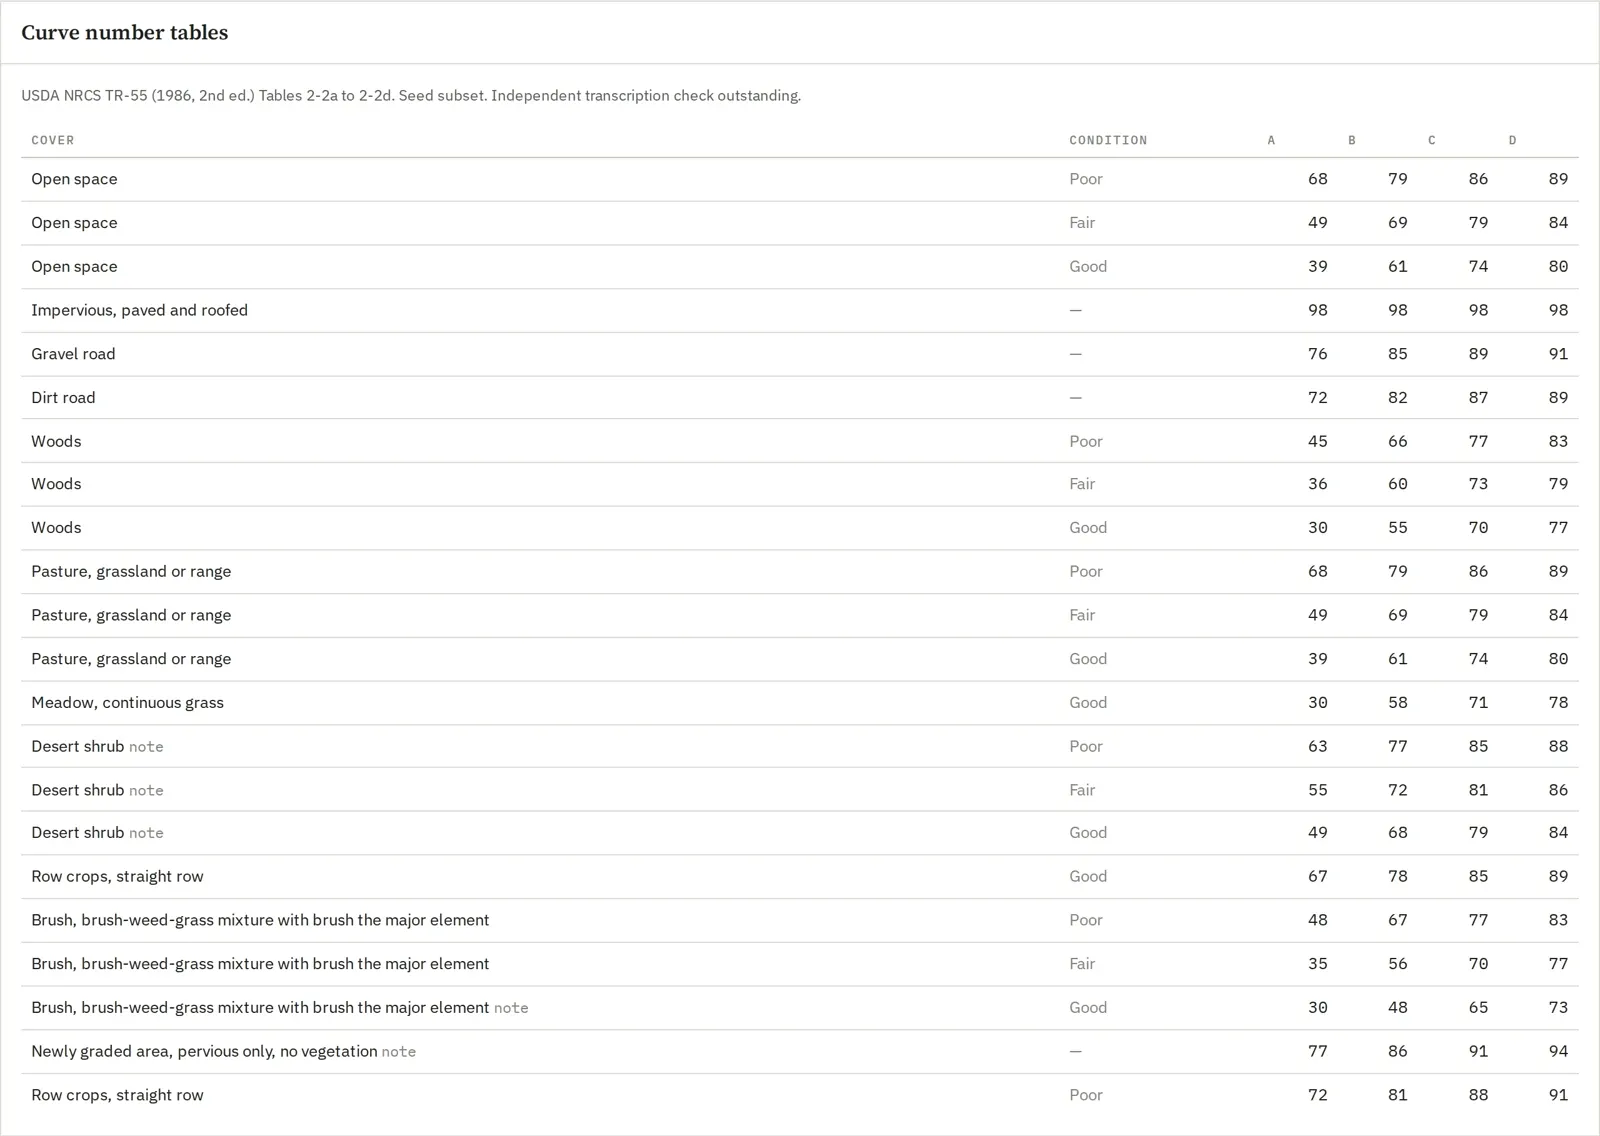
The curve number tables panel. Its note reads: USDA NRCS TR-55, 1986 second edition, Tables 2-2a to 2-2d, seed subset, independent transcription check outstanding. A table with columns cover, condition and the four hydrologic soil groups A, B, C and D. Rows include open space in poor, fair and good condition at 68 79 86 89, 49 69 79 84 and 39 61 74 80; impervious paved and roofed at 98 across all four groups; gravel road, dirt road, woods, pasture, meadow, desert shrub, row crops and brush.
The curve number tables. The panel states on its own face that this is a seed subset and that the independent transcription check is outstanding, rather than leaving a reviewer to assume otherwise.

Where the inputs come from

Public data, named, dated and cached

You supply the boundary and the design storm. Everything below is retrieved, and each retrieval is recorded with its URL, its status, the timestamp and a hash of the response body, so a figure in a report traces to a specific server response on a specific day.

The boundary is drawn on the map, or edited vertex by vertex, or cut with a hole where a building is excluded. The enclosed area is computed on the ellipsoid and shown while you draw, because an acreage that appears only after you save is an acreage nobody checks.
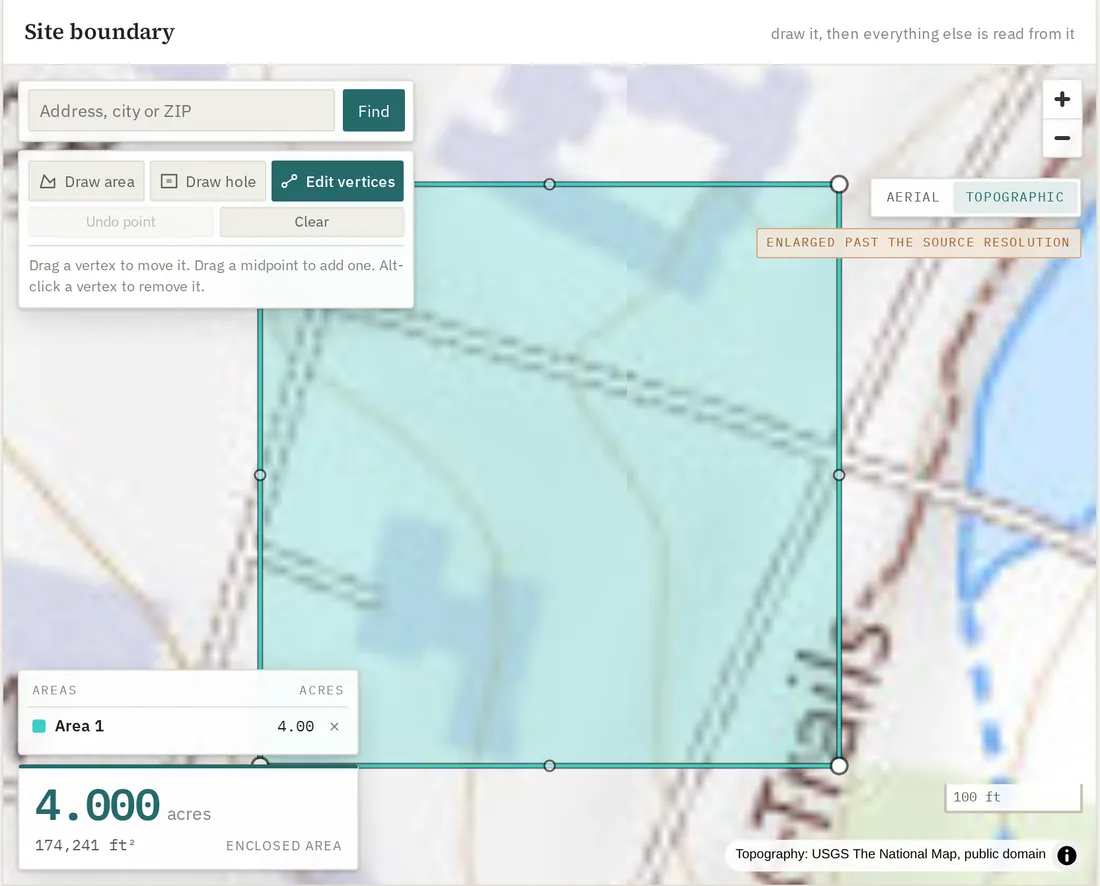
The drawing surface: a topographic basemap with a four acre rectangular site boundary drawn on it in teal, an address search box and drawing tools floating over the map, a legend listing the drawn area, and a large readout showing 4.000 acres and 174,241 square feet of enclosed area.
The drawing surface. Basemaps are USGS topographic and imagery, and the tool says so on the map, including when you have enlarged past the resolution the source actually has.
Soil map units and hydrologic groups USDA Soil Data Access, SSURGO
Map unit names, keys and published groups, with dual groups kept as B/D and unrated units carried as named gaps rather than filled.
Land cover and measured imperviousness Annual NLCD, via USGS and MRLC
Class shares and a measured impervious fraction from the fractional raster. The impervious share is never inferred from the class code, because the published composite rows already contain one.
SlopeUSGS 3DEP elevation
Computed server side over the boundary and reported in percent rather than in degrees, because the two are not interchangeable and confusing them understates slope. It feeds time of concentration, which also needs a flow length, and no elevation raster contains one, so that stays your input.
Design rainfallNOAA Atlas 14, PFDS
Depth and duration for the point, with the edition recorded. A design storm is a depth and a shape, and the shape is stated separately.
Address lookupUS Census Geocoder
Used only to place the map view. The returned point is interpolated along a street centerline and offset to one side, so it is never used as an area of interest, and the interface shows the block range it came from.

These are unfunded public services, so every response is cached, and a second look at the same site does not ask them again.

Read this before you use it

Aerial imagery is a guess you have to accept

The tool will fetch a public-domain NAIP photograph of your boundary and sort its pixels into impervious, vegetation, bare soil, water and shadow. That is not a measurement of your site and it is not treated as one. It arrives pending: you can see it, it is labeled a guess, nothing in the product reads it, and it becomes a figure in your record only when you accept it. Accepting is recorded with your name, the time, the revision you acted on and the reason you gave, and the report prints it as an override with the provider and the flight date beside it. Rejecting costs you one click and no reason, and the rejection stays on the record, because a guess you looked at and refused is evidence about the site.

The photograph may predate your designNAIP flies on a rolling cycle of a few years
A site graded last spring is not stale in the imagery, it is absent. No amount of careful classification recovers a building that was not there when the plane flew. The acquisition date is stored, shown with the result and printed on the report, so you are deciding against a date rather than against "recent".
It is flown leaf onGrowing season, by design
Leaf on is what makes the vegetation signal strong and it is also what hides pavement. A driveway under a mature canopy is not visible in the image, so it is not in the classification, and the impervious fraction is low by whatever that driveway is worth. This is the failure mode to check first on a wooded lot.
It is an unsupervised clustering, not a measurementThe pixels of one photograph, grouped by color
The classes are fitted to the scene in front of it rather than read off a published map, because the values are uncalibrated digital numbers and a threshold tuned on one scene is a statement about that scene's light. Nobody publishes this method. The result is recorded as a named assumption, never as a citation, and the report says so on its face.
Three-band imagery is refused outrightNo near infrared, no answer
Healthy leaves reflect strongly in the near infrared and weakly in the red; asphalt and roofing reflect the two about equally. That contrast is the whole basis of the separation, so where a state was flown without the fourth band the tool refuses rather than separating pavement from grass on brightness alone and handing you a number that looks the same.
Coverage is the contiguous United StatesBecause the aerial photographs cover only the lower 48
A boundary outside the published extent is refused with the reason, and the refusal says a different provider is the remedy rather than inviting a retry that cannot succeed.
It is checked against an independent published measurementThe 30 m fractional impervious raster
Beside the classification the tool reads the published impervious fraction over the same boundary and reports the signed difference, whether the published figure falls inside the band the photograph supports, and whether the comparison can discriminate at all, which on a small site it often cannot: nineteen pixels of a 30 m raster carry a sampling error wider than any tolerance worth setting. Showing the guess and hiding the only available evidence about it would be the dishonest arrangement.

The register the product runs on

Check the sources before you trust the output

Every regulatory document this product holds is tracked in the open: what has been found, what has been downloaded and parsed, and what a person has reviewed. The register is published, needs no account, and is as specific about the gaps as it is about the coverage.

The reference library the assistant quotes from holds seventy-four documents and 23,180 passages across twenty-nine states, and growing.
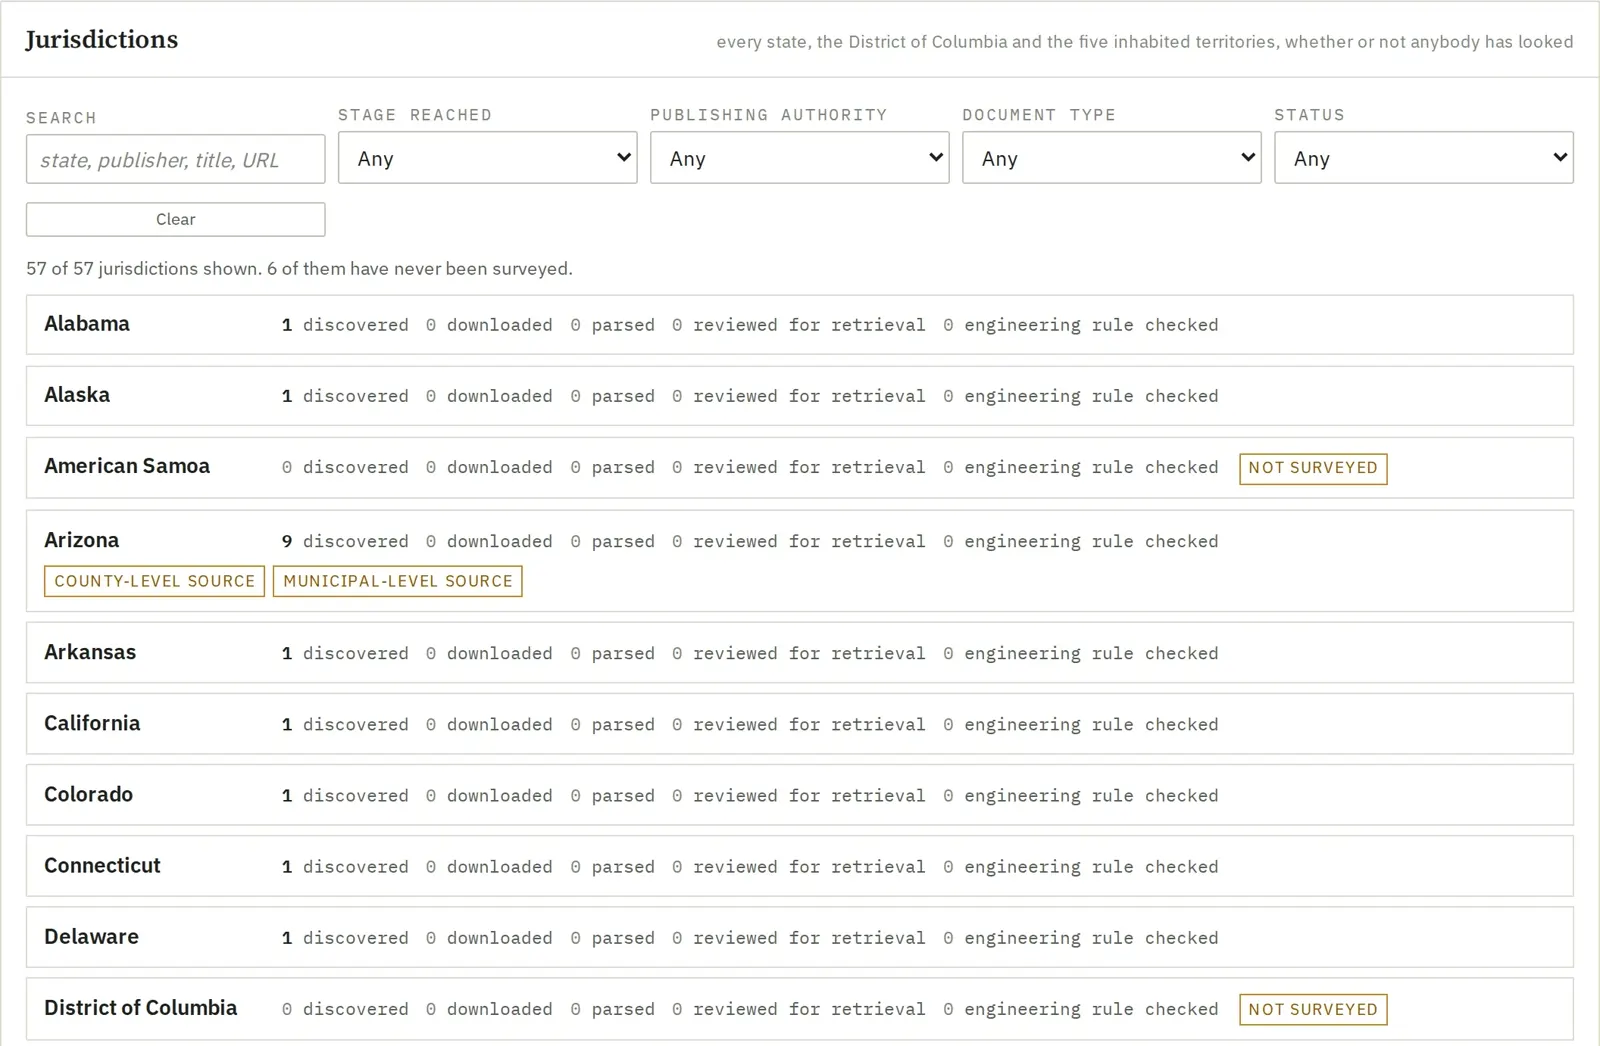
The jurisdictions panel of the source coverage page, headed: every state, the District of Columbia and the five inhabited territories, whether or not anybody has looked. Filters for search, stage reached, publishing authority, document type and status. A line reads 57 of 57 jurisdictions shown, 6 of them have never been surveyed. Rows for Alabama, Alaska, American Samoa marked not surveyed, Arizona with 9 discovered and county and municipal level source tags, Arkansas, California, Colorado, Connecticut, Delaware, and the District of Columbia marked not surveyed.
A jurisdiction listed is not a jurisdiction held. A jurisdiction appearing there means somebody found a web page for it. Six have never been surveyed, and the page says which six rather than rounding them away.

Every public dataset CurveNumber reads, who publishes it, the edition in use and when it is read is on the data sources page, the page every report points to.

What it is for, and what it is not

CurveNumber computes runoff volume and peak discharge for a site's existing and proposed conditions by the NRCS methods (TR-55 and NEH-630), checks stormwater practices against them, and writes a report a plan reviewer can follow. It is a runoff and peak calculator with practice checks. It is not a full stormwater design package, and it does not replace one where a project needs:

  • a site outside the contiguous United States;
  • detention design from scratch: CurveNumber routes the practices you size; it does not size a pond for you or route a network of connected basins.

Peaks use the NRCS standard unit hydrograph, or the NRCS Delmarva unit hydrograph (peak rate factor 284) on the Delmarva coastal plain and where a local rule asks for it; every peak names the one it used. Design rainfall comes from NOAA Atlas 14, and in Washington and Oregon from NOAA Atlas 2 (1973), for 24 hour storms of 2 to 100 years; type other durations and return periods from the published source.

Two free sites, then USD 100 per site

Every new account gets two free site codes. After that, USD 100 opens a 30-day working window on a site, and USD 20 adds each extra 30 days.