Examples Example 3 of 4
Example 3 · Georgetown, Delaware, and Hillsboro, Oregon
Special rainfall and unit hydrograph cases
Two sites, one on each coast, where the rainfall source or the shape of the hydrograph is not the usual one.
Part A: Farm field to warehouse, Georgetown area, Delaware Part B: Pasture to townhomes, Hillsboro, Oregon
About this example
This is a real run on app.curvenumber.com, made under the CurveNumber Examples account. The place is real. The clients, the plans and the site walk findings are fictional, and the run says so wherever they are named.
What this example shows
- Part A: wetland land cover, which has no row in TR-55, and the presets CurveNumber offers for it.
- Part A: a dual soil group (B/D) and how the drainage question is answered.
- Part A: naming the rule that sets the design storm.
- Part A: the NRCS Delmarva unit hydrograph, and a comparison run with the standard one, published side by side.
- Part B: NOAA Atlas 2 rainfall, which still governs in Washington and Oregon.
- Part B: the NRCS Type IA storm, and its early peak, with a dual soil group (C/D) answered both ways.
Part A · Sussex County, Delaware
Farm field to warehouse, Georgetown area
The job. A 19.10 acre field and scrub tract near Georgetown in Sussex County, Delaware, becomes a warehouse with a truck court and parking. A forested wetland along the stream stays as a buffer. The design checks the 100-year, 24-hour storm.
A1Two questions before any number
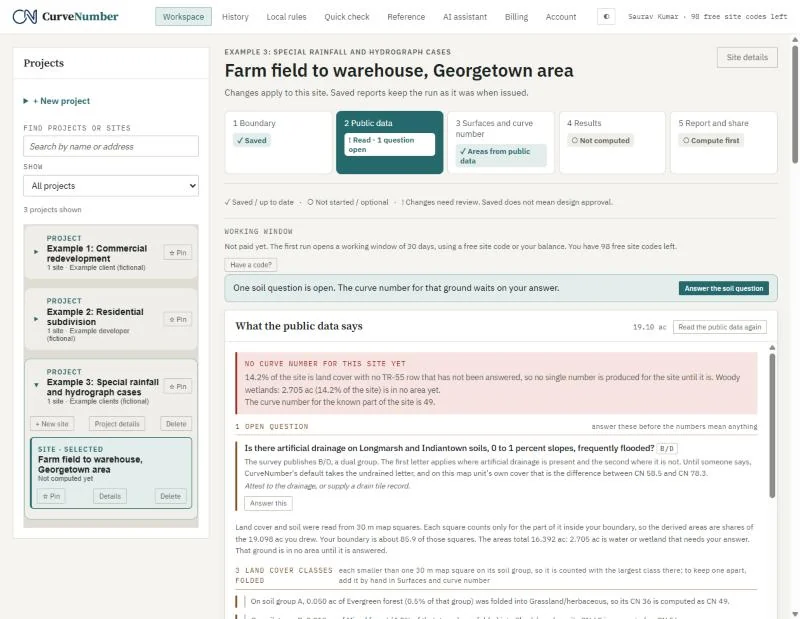
After reading the public data, CurveNumber shows no curve number for this site yet, and two questions.
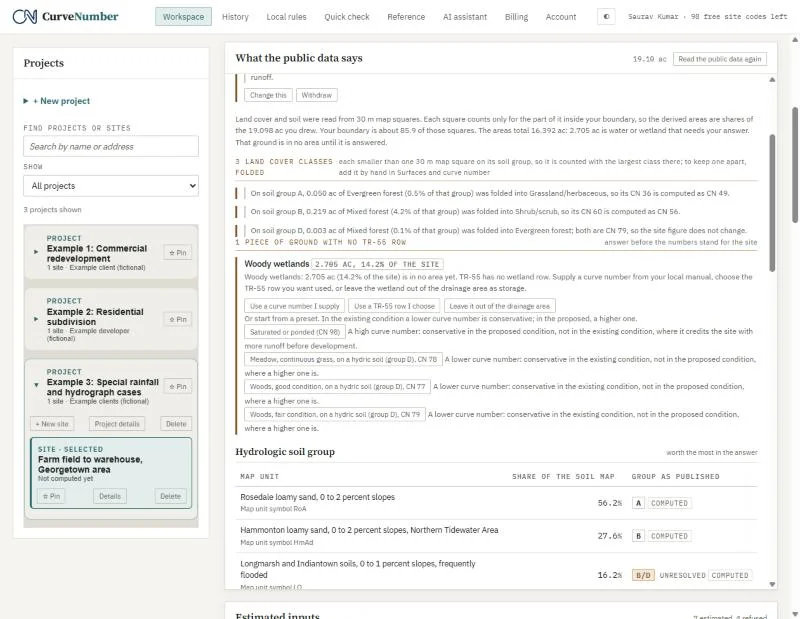
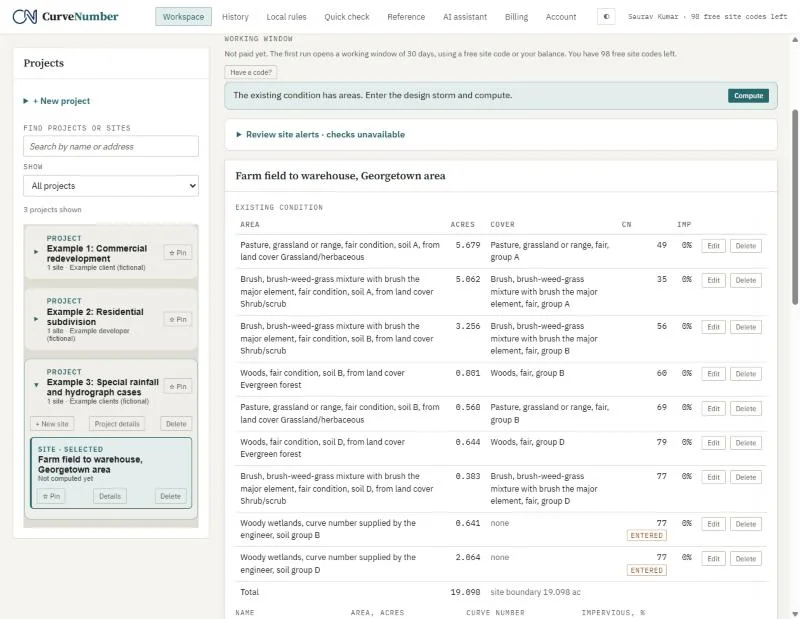
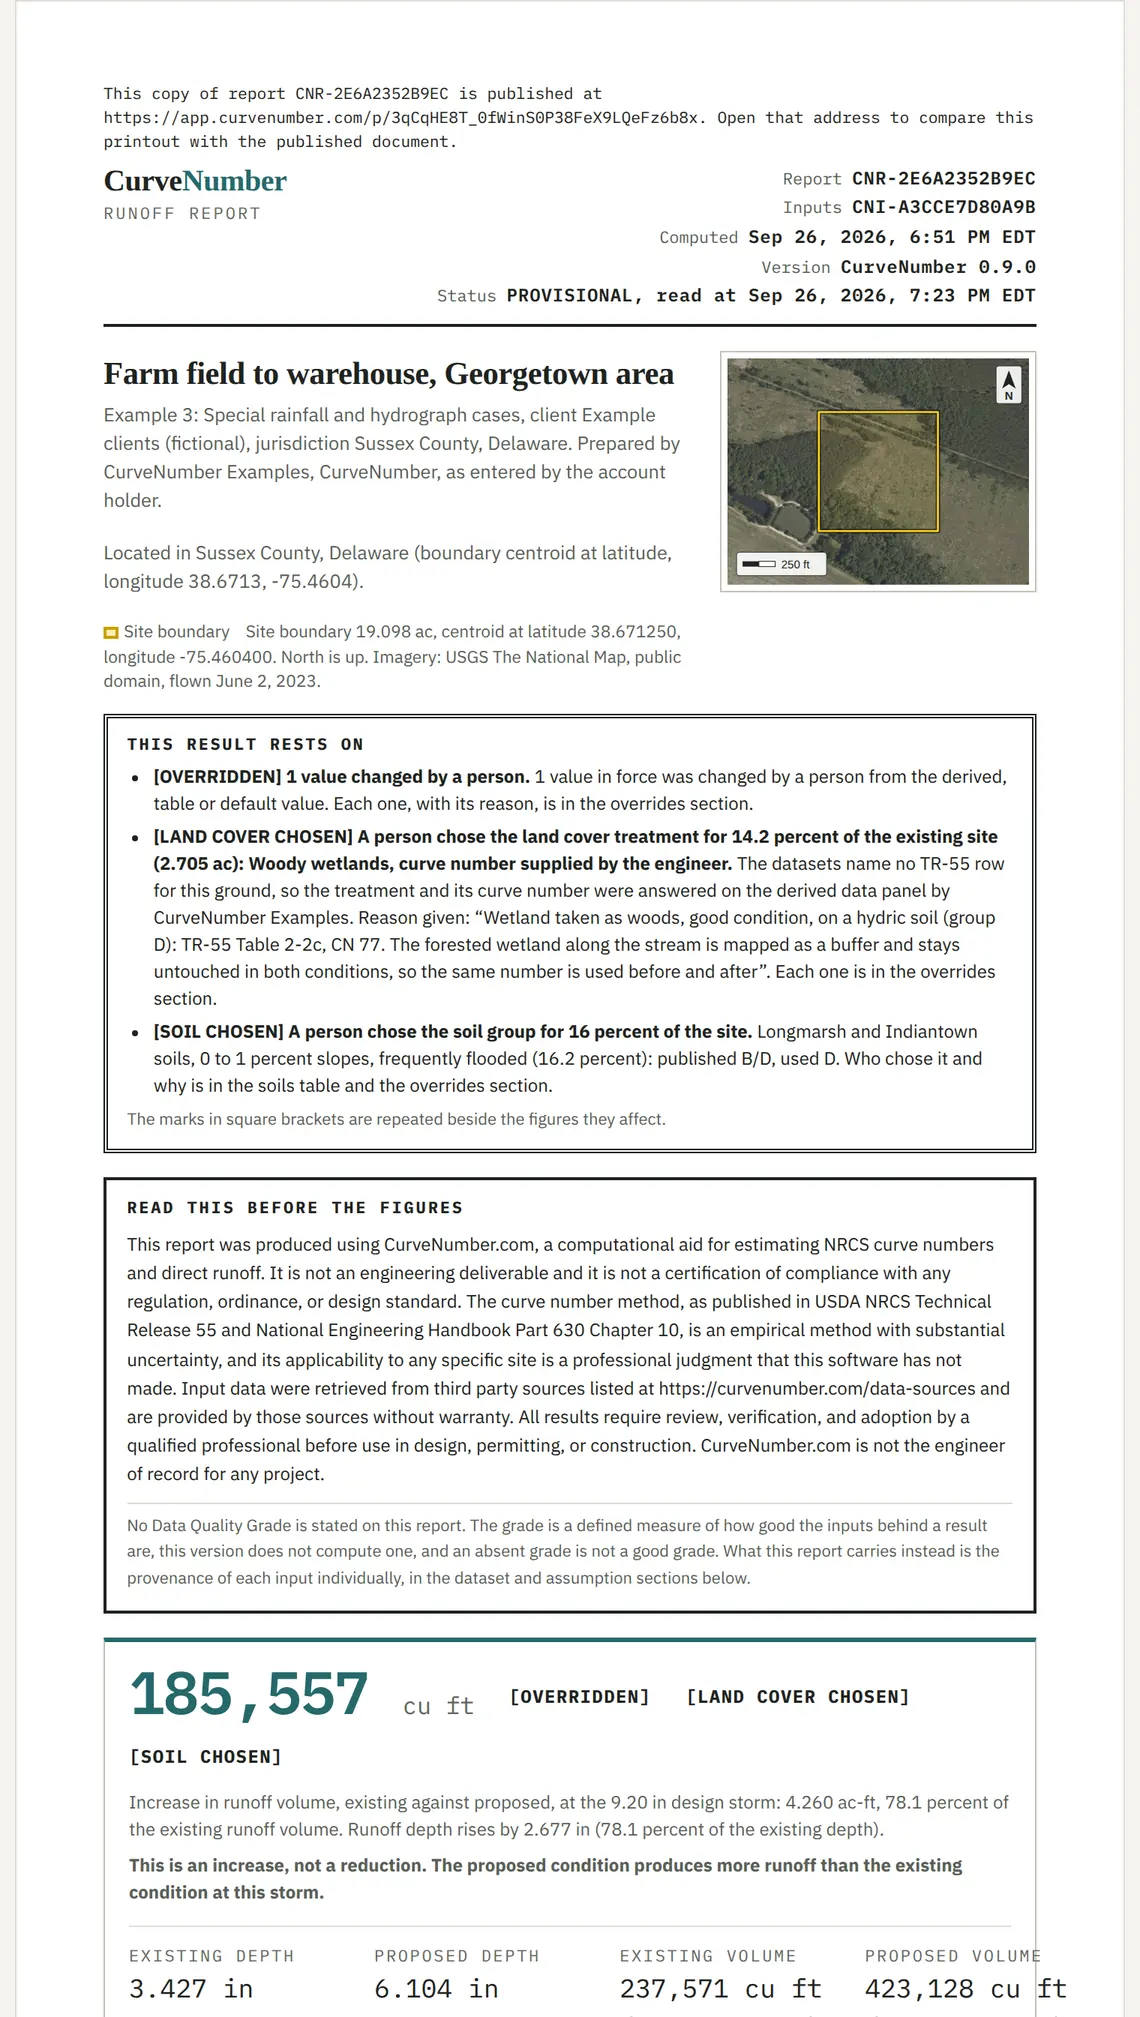
- Wetlands. 2.705 acres (14.2 percent) are woody wetlands. TR-55 has no wetland row, so CurveNumber will not pick one. You can supply a curve number from your local manual, choose a TR-55 row, or leave the wetland out of the drainage area as storage. It also offers presets, each with a note on which way it errs: a high number is conservative in the proposed condition, a low one in the existing.
- Drainage. The Longmarsh and Indiantown soils are published as B/D: group B if drained, D if not. On this site the difference is CN 58.5 against CN 78.3.
A2Answering them
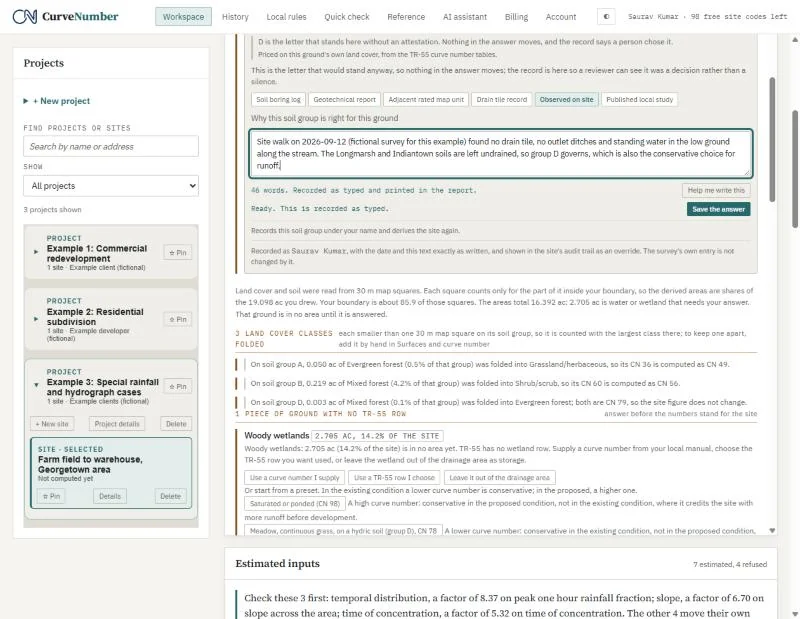
For the drainage question we chose D, marked the source Observed on site, and wrote why: the (fictional) site walk found no drain tile, no outlet ditches and standing water along the stream.
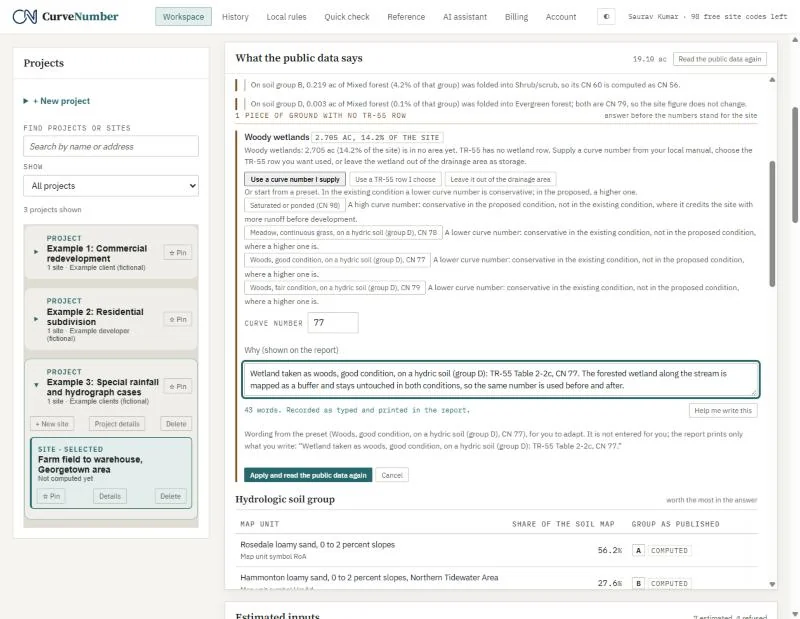
For the wetland we started from the preset Woods, good condition, on a hydric soil (group D), CN 77 and wrote that the forested wetland is a buffer left untouched in both conditions. CurveNumber drafts the wording from the preset, but nothing is entered until you confirm it.
With both answered, the areas add up to the full 19.098 acres and the site has a curve number.
A3What else CurveNumber estimated
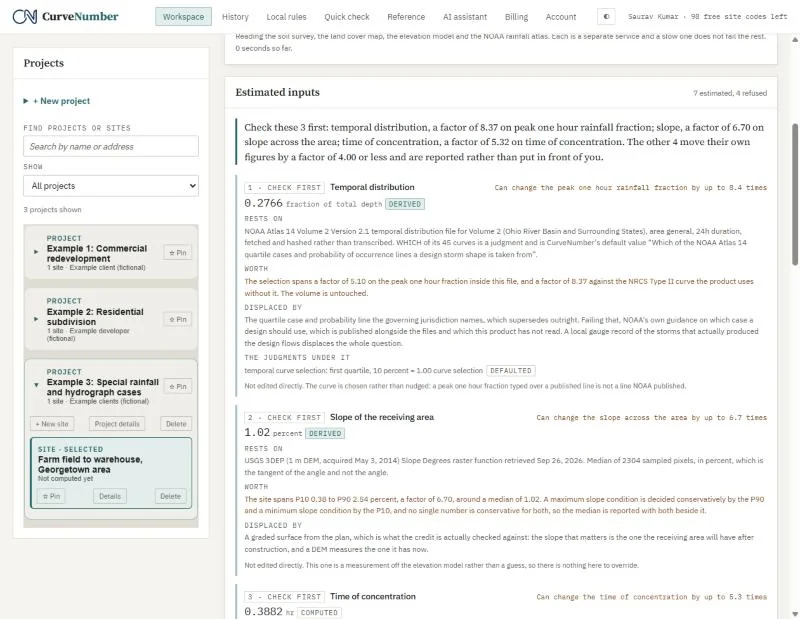
The Estimated inputs panel lists every figure CurveNumber filled in for you, ranked by how much it can move the answer, with what it rests on and what would displace it. Here the three to check first are the storm's time distribution, the slope, and the time of concentration.
A4The storm, with the rule that requires it
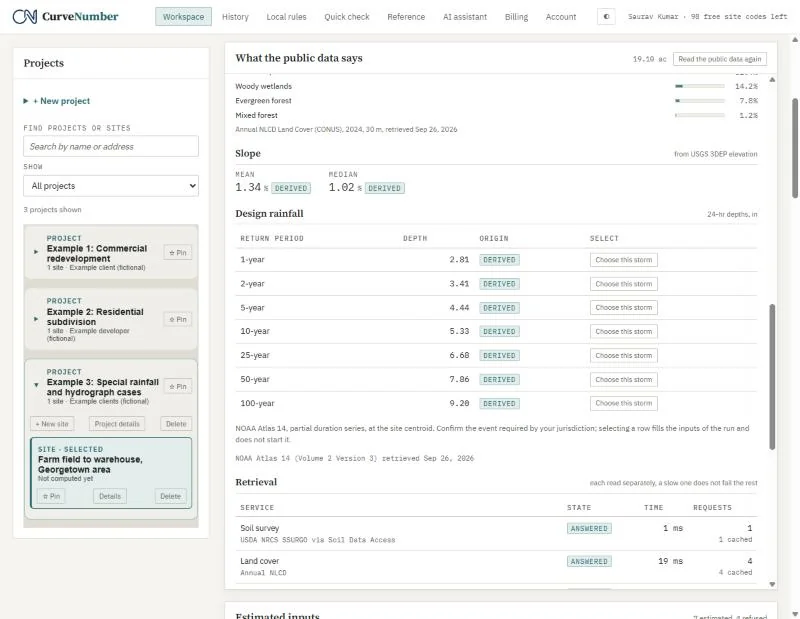
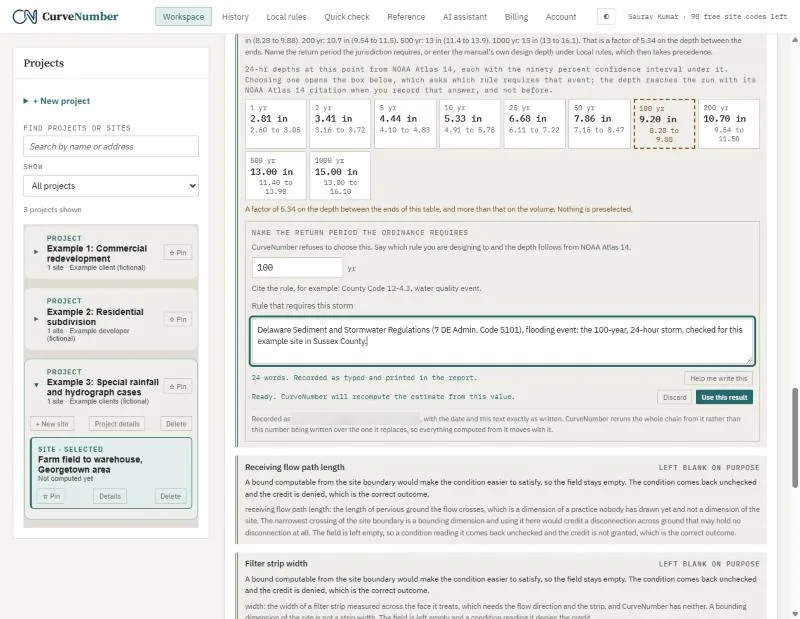
The rainfall table shows the NOAA Atlas 14 depths at the site, each with its 90 percent confidence range. Choosing the 100-year storm (9.20 inches) opens a box that asks which rule requires that event. We cited the Delaware Sediment and Stormwater Regulations' flooding event. The citation prints on the report next to the depth.
A5The proposed warehouse
We copied the existing areas to the proposed condition, kept the wetland and the group D woods and brush, and replaced the upland field and scrub with 8.0 acres of roof and pavement (CN 98) and 7.366 acres of lawn in good condition (CN 39 on group A, 61 on group B).
A6The Delmarva unit hydrograph
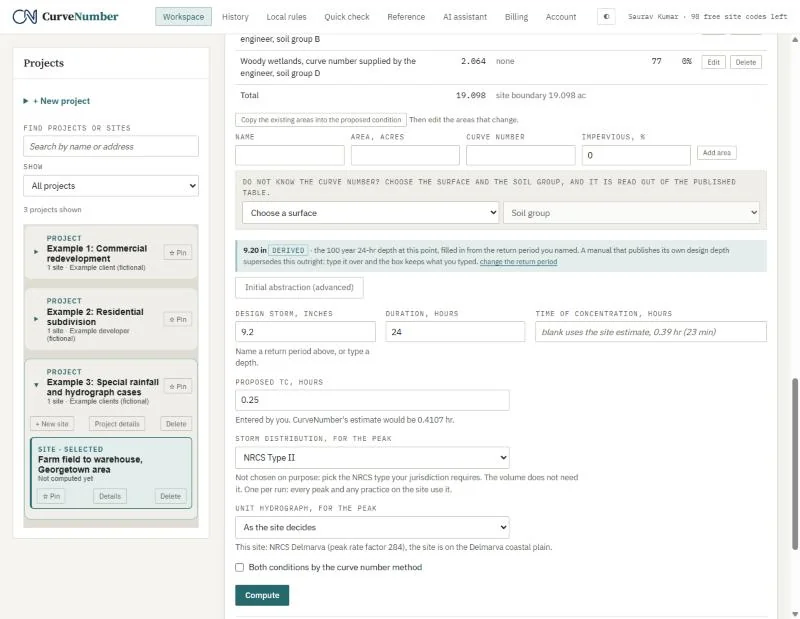
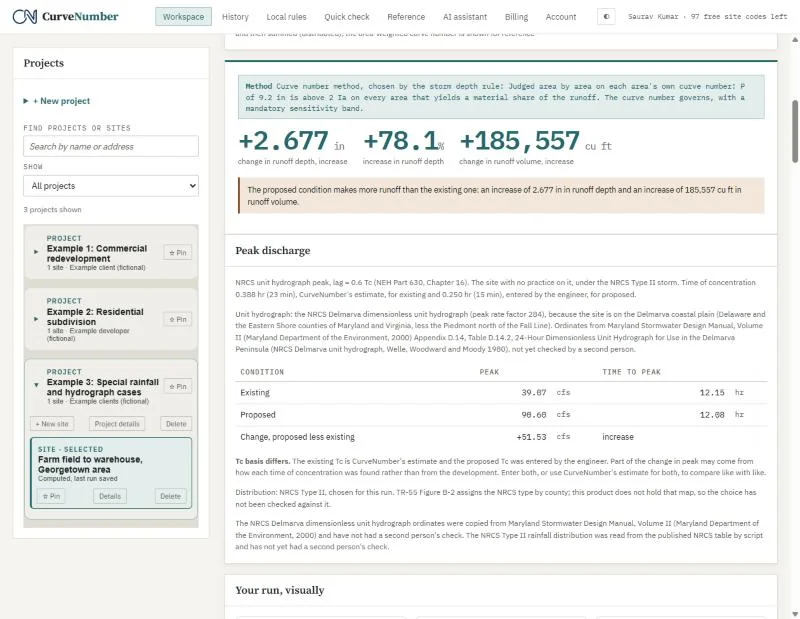
The Compute form names the unit hydrograph before you run: This site: NRCS Delmarva (peak rate factor 284), the site is on the Delmarva coastal plain. The Delmarva curve was developed for the flat, storage-rich coastal plain of Delaware and the Eastern Shore, and gives lower peaks than the standard curve. CurveNumber uses it by default inside the Delmarva coastal plain (less the Piedmont north of the Fall Line), and a local rule you enter overrides it.
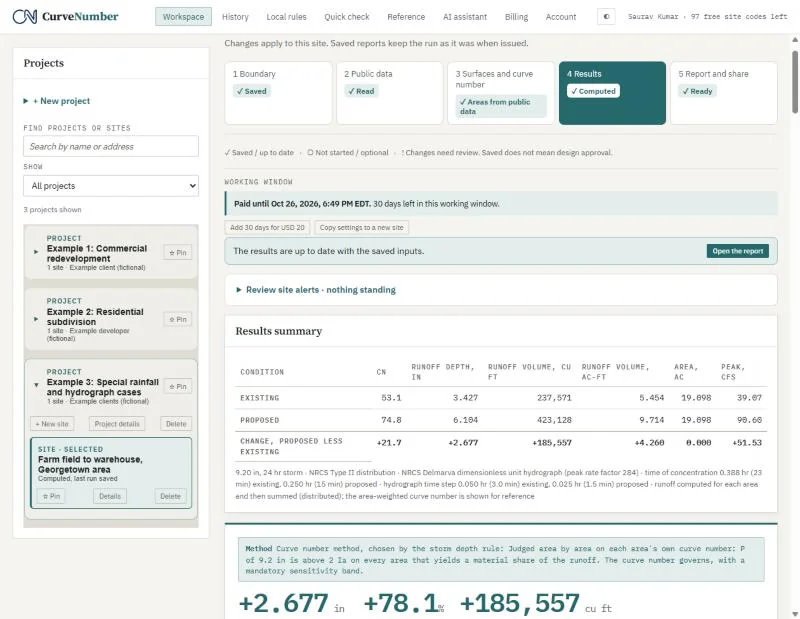
| Curve number | Runoff depth | Runoff volume | Peak | |
|---|---|---|---|---|
| Existing | 53.1 | 3.427 in | 237,571 cu ft | 39.07 cfs |
| Proposed | 74.8 | 6.104 in | 423,128 cu ft | 90.60 cfs |
We checked both depths by hand. The peak section says which unit hydrograph was used, why, and where its ordinates come from. It also warns that the existing time of concentration is CurveNumber's estimate while the proposed one (0.25 hours) was typed by us, so part of the change in peak may come from that difference and not from the development.
A7The same site on the standard curve
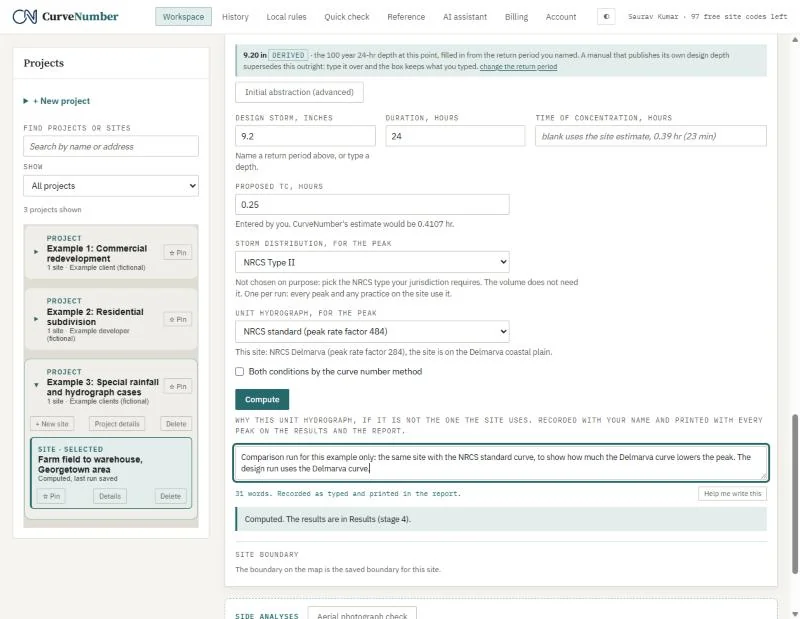
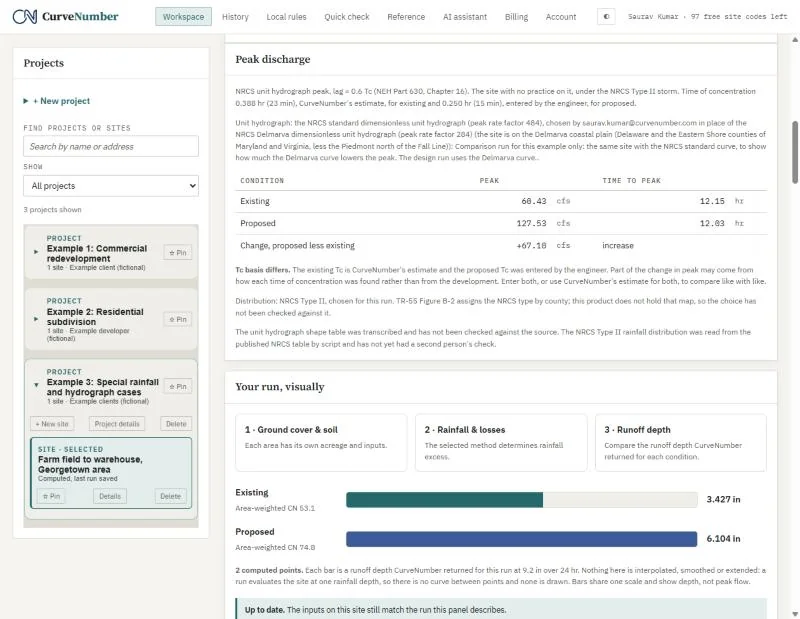
To show what the choice is worth, we ran the site again with the NRCS standard unit hydrograph. Choosing the other curve takes a written reason, which prints with every peak.
| Peak | Delmarva (284) | Standard (484) |
|---|---|---|
| Existing | 39.07 cfs | 60.43 cfs |
| Proposed | 90.60 cfs | 127.53 cfs |
The volumes do not change; only the peaks do, by about a third.
A8Publishing with a comparison
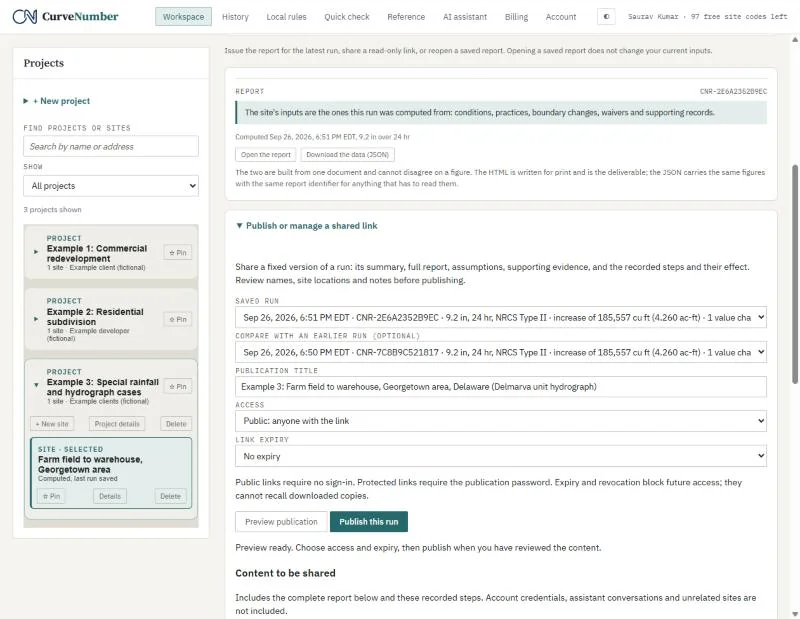
When you publish, you can pick an earlier run to compare against. The published page then carries a table of both runs' figures side by side.
The published example
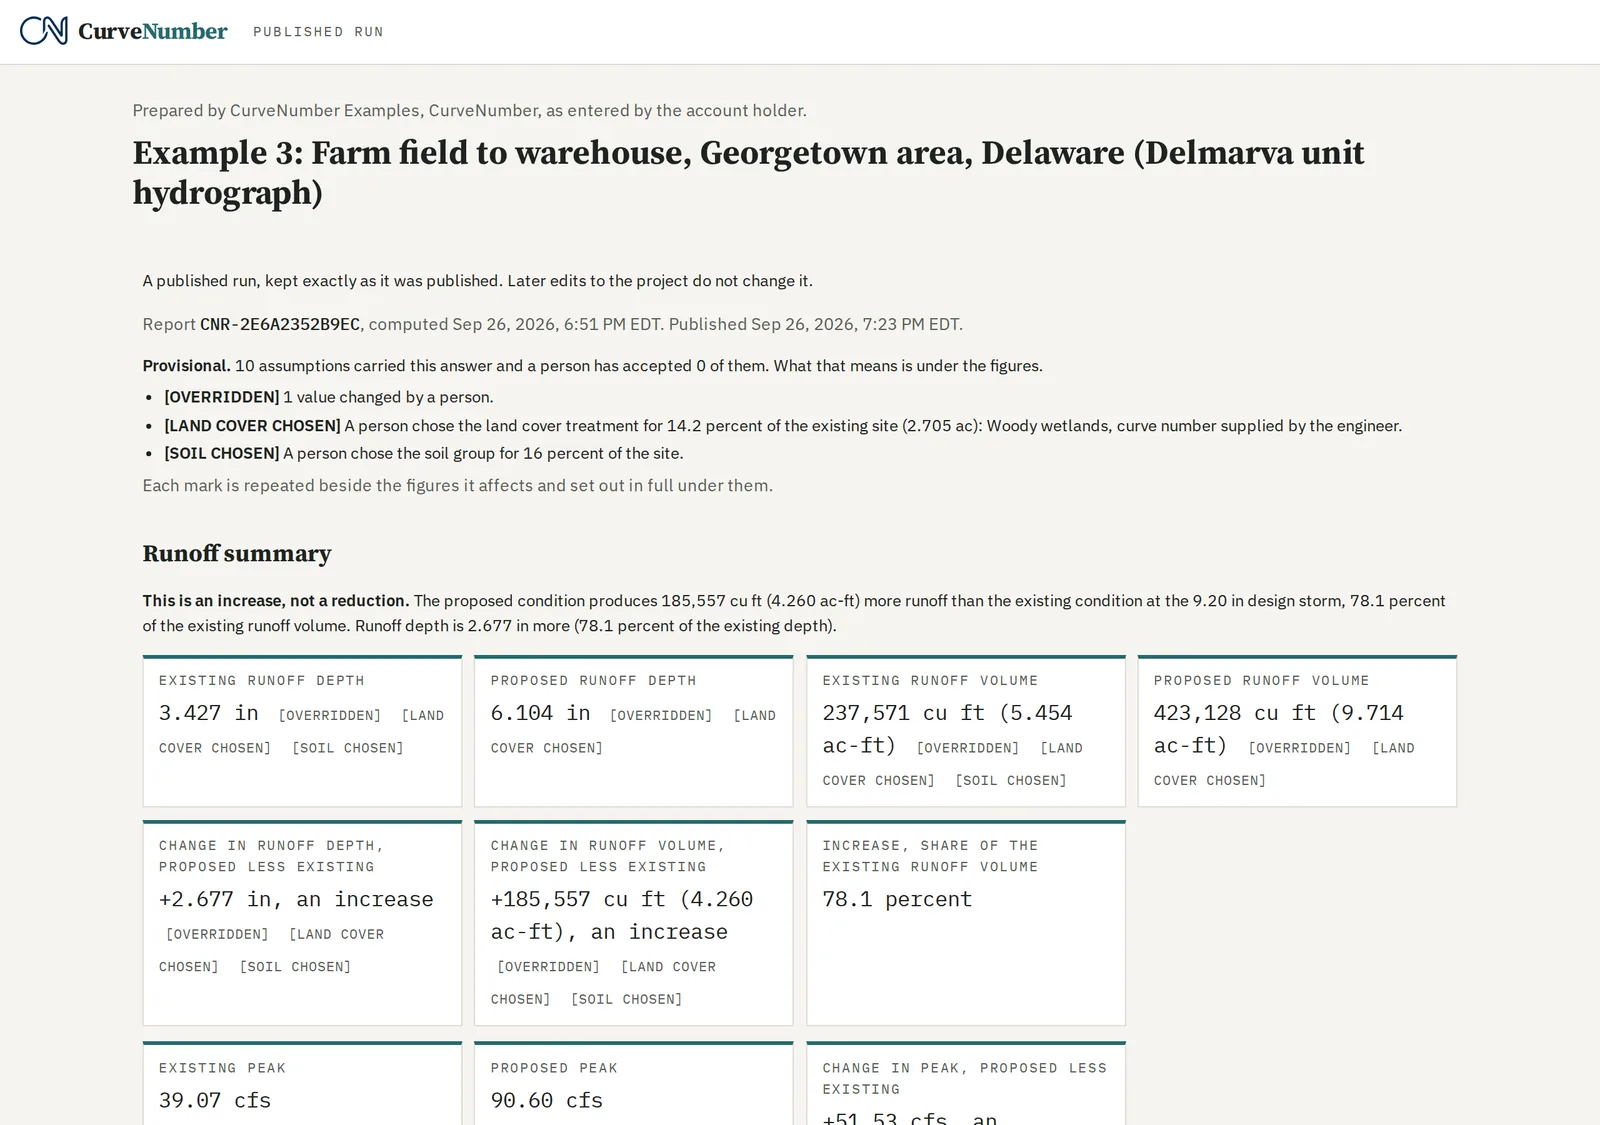
A fixed, read-only page with the full report, exactly as it was published. It needs no account.
https://app.curvenumber.com/p/3qCqHE8T_0fWinS0P38FeX9LQeFz6b8x
Part B · Washington County, Oregon
Pasture to townhomes, Hillsboro
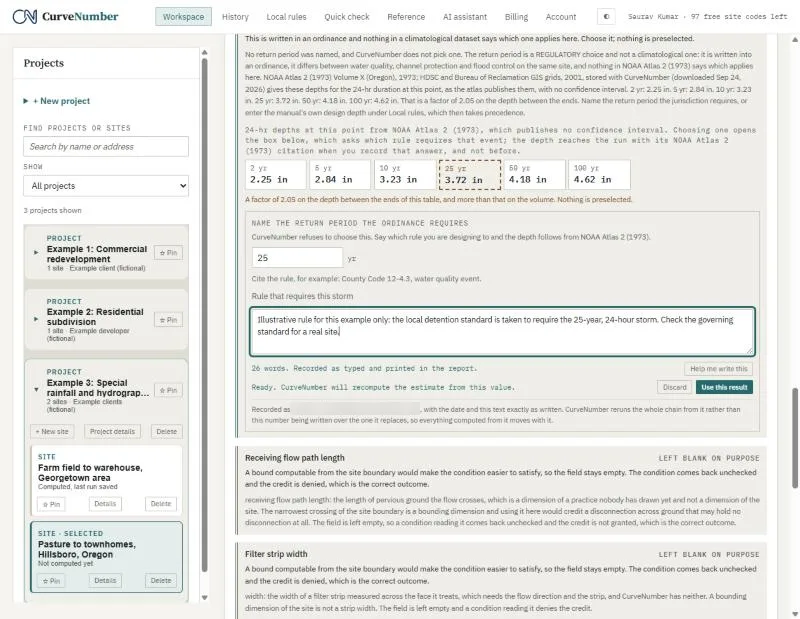
The job. A 12.87 acre pasture on the west side of Hillsboro in Washington County, Oregon, becomes townhomes. The design checks the 25-year, 24-hour storm.
B1NOAA Atlas 2 rainfall
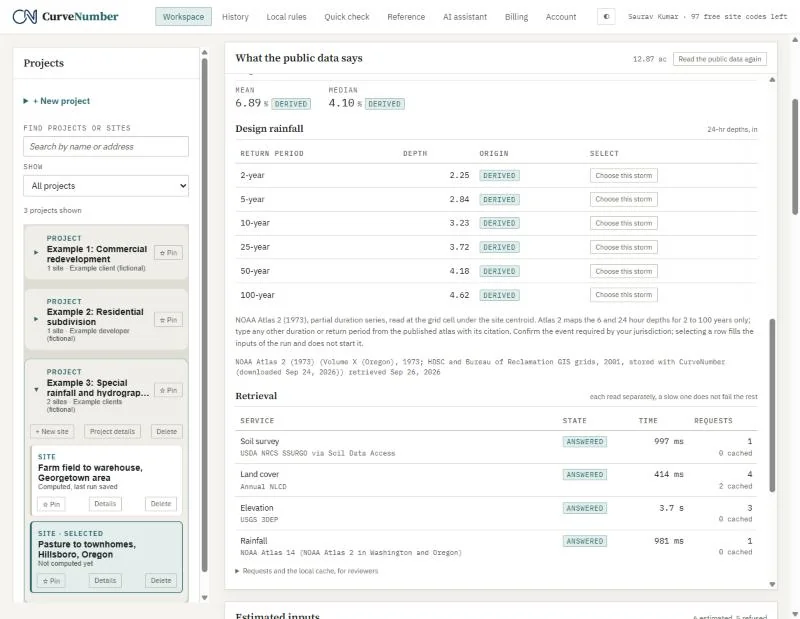
In Washington and Oregon, CurveNumber reads the NOAA Atlas 2 (1973) grids instead of Atlas 14, and says so on the rainfall table. Atlas 2 publishes 6 and 24 hour depths for 2 to 100 years only and no confidence interval, and the storm chooser says that too.
| Return period | 2-yr | 10-yr | 25-yr | 100-yr |
|---|---|---|---|---|
| 24-hour depth | 2.25 in | 3.23 in | 3.72 in | 4.62 in |
B2One soil drained, one not
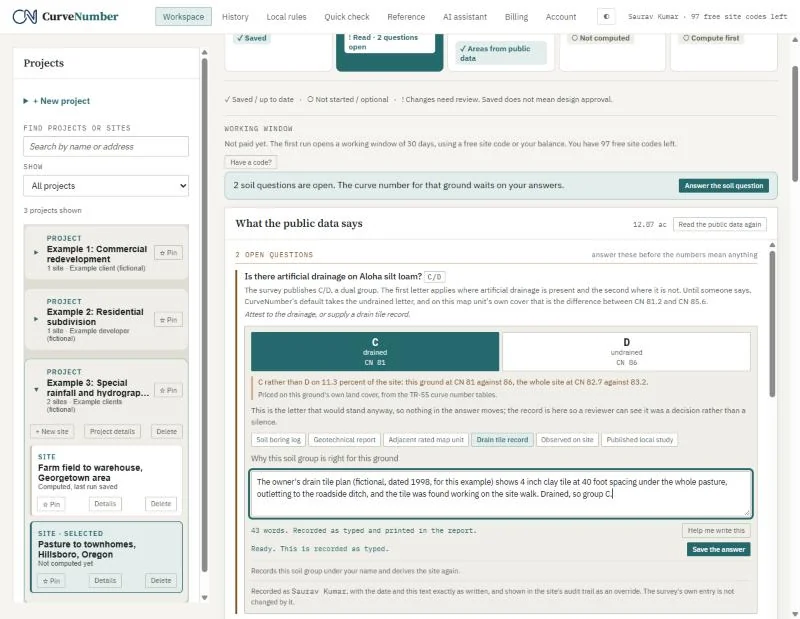
Two map units are published as C/D. For the Aloha silt loam we chose C, citing a (fictional) drain tile plan: 4 inch tile at 40 foot spacing under the pasture, found working on the site walk. For the Wapato silty clay loam in the low swale, which the tile does not reach, we chose D. Each answer shows how much it moves the site's curve number before you save it.
B3Townhomes and the Type IA storm
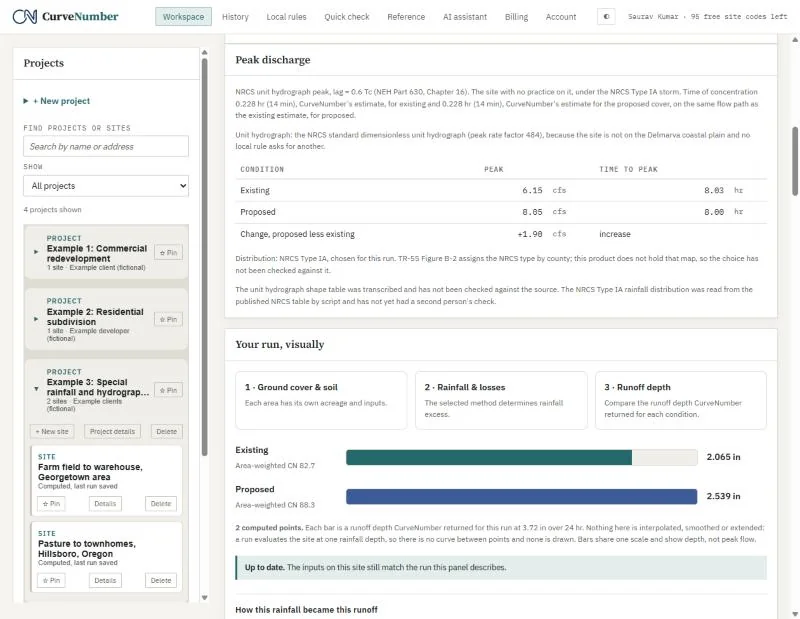
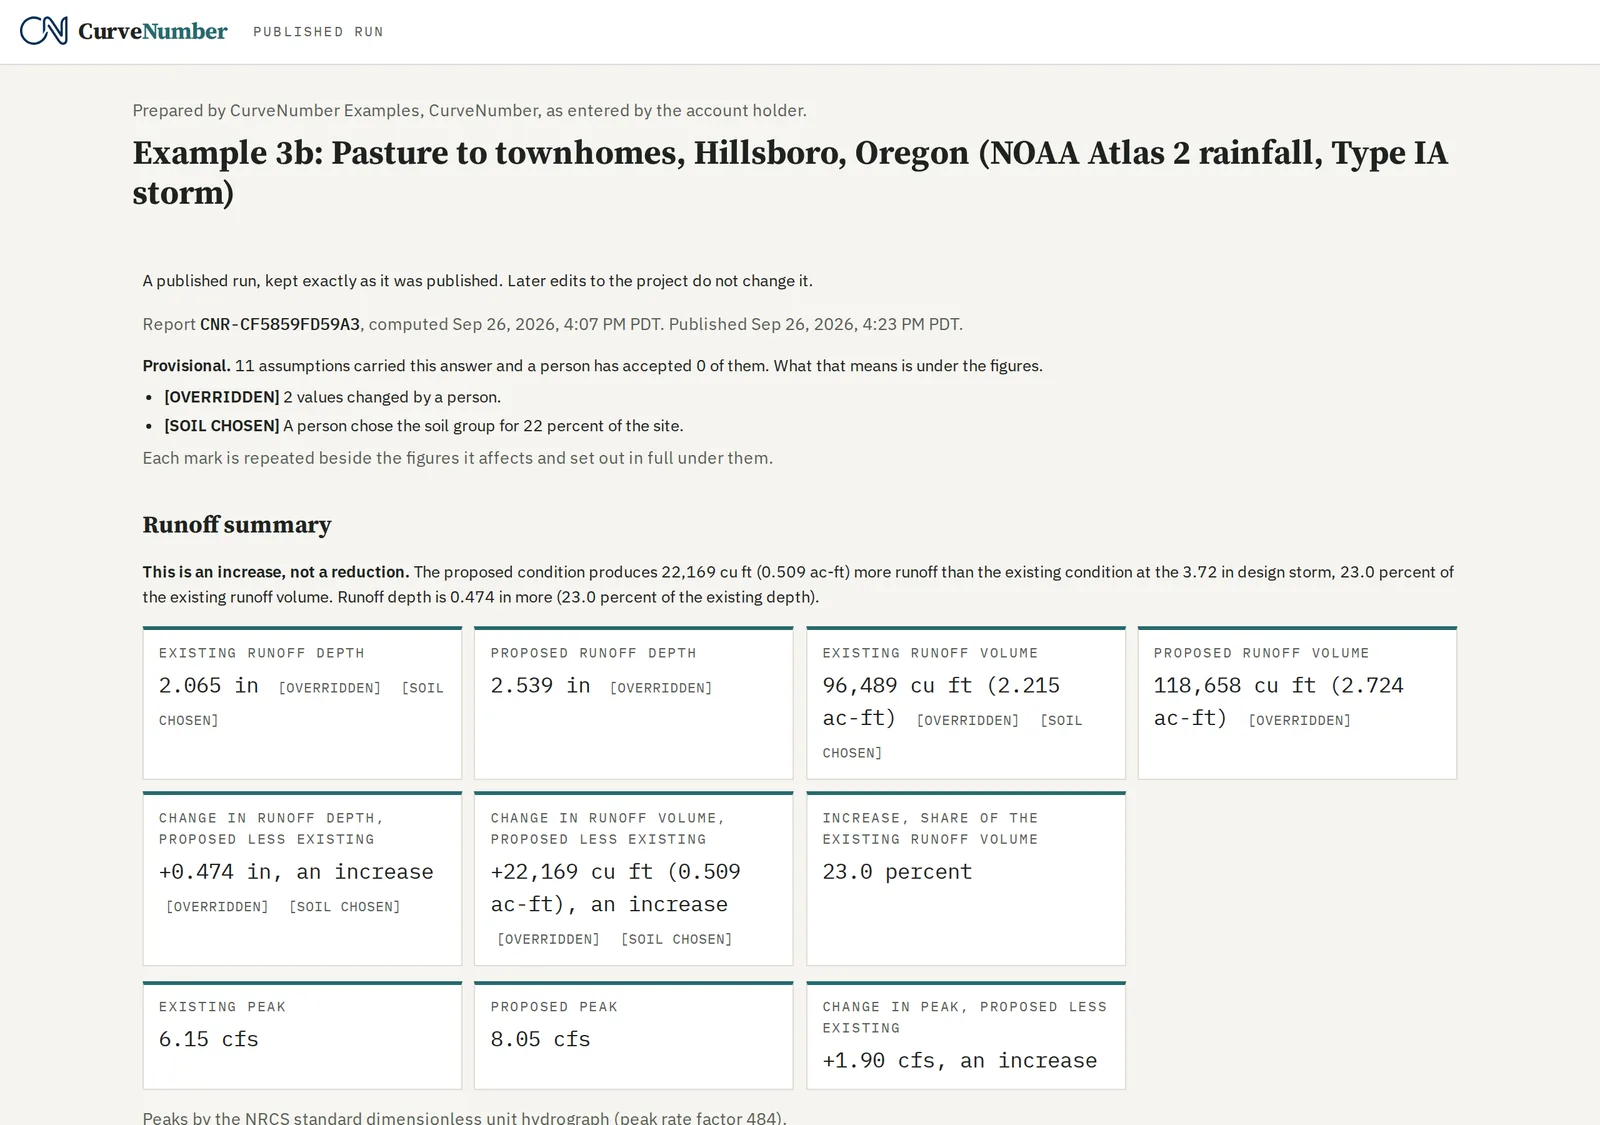
We replaced the pasture and open lawn with townhomes (TR-55: 1/8 acre or less, 65 percent impervious; CN 90 on group C, 92 on group D) and computed with the NRCS Type IA distribution used west of the Cascades.
| Curve number | Runoff depth | Runoff volume | Peak | Time to peak | |
|---|---|---|---|---|---|
| Existing | 82.7 | 2.065 in | 96,489 cu ft | 6.15 cfs | 8.03 hr |
| Proposed | 88.3 | 2.539 in | 118,658 cu ft | 8.05 cfs | 8.00 hr |
The peak comes at about 8 hours into the storm, not 12 as with Type II, because the Type IA storm puts its heaviest rain early. We checked both depths by hand.
The published example
A fixed, read-only page with the full report, exactly as it was published. It needs no account.
https://app.curvenumber.com/p/JiRxJNXc-VgJ069M-b2XmQf0-zseuf5P